R – native and ggplot boxplots

date <- seq.Date(as.Date("2013-06-01"), as.Date("2014-05-31"), "days") set.seed(100) x <- as.integer(abs(rnorm(365))*1000) df <- data.frame(date, x) boxplot(df$x ~ months(df$date), outline = FALSE,las=2)
library(ggplot2)  ggplot(df) +   geom_boxplot(aes(reorder(format(date,'%B'),date),fill=format(date,'%Y'),x)) +         xlab('Month') + guides(fill=guide_legend(title="Year")) +         theme(axis.text.x = element_text(angle = 45)) 

R – ggplot example

$ head dl.csv  time,code,count 6:59,200,31 7:00,200,1841 7:00,502,3644 7:01,200,369  > x<-read.csv("dl.csv") > library(dplyr) > library(tidyverse)  > ggplot(x,aes(time,count,color=code))+geom_point()+scale_x_discrete(breaks = levels(x$time)[c(T, rep(F, 5))])+theme(axis.text.x = element_text(angle = 90, vjust = 0.5, hjust=1))  

R – graph by month

> options(scipen=5) > jan20<-x[grepl("2023-01",x$date) & x$enabled > 0 & x$ignore==0,] > barplot(tapply(jan20$users,jan20$date,sum)/1000,las=2,main="Jan 2023 - by month",col=rainbow(10),cex.names=0.8)

R – Read in CSV

> setwd("/Users/mark/Documents/Stats") > x<-read.csv("sites.csv",sep="\t",stringsAsFactors = F) > summary(x$url) Length     Class      Mode     983002 character character   > summary(x$score)    Min. 1st Qu.  Median    Mean 3rd Qu.    Max.    NA's   -3.000  -2.000  -1.000   1.977  -1.000  25.000       1 

R – Package List

How to list all packages that have been imported into current session

> (.packages())

Example output

> (.packages()) [1] "stats"     "graphics"  "grDevices" "utils"     "datasets"  "methods"   [7] "base" 

To see if a package is installed:

> x<-grep("tidyverse",installed.packages()) > installed.packages()[x]

Install a number of packages as below:

> install.packages(c("nycflights13", "gapminder", "Lahman"))

MongoDB Intro

  1. Connect to mongodb: $ mongo
  2. show dbs;
  3. db.<collection>.stats(1024000000) # gb – ref
  4. db.<collection>.find({},{<field>:<value>}).sort({<field>:1}).limit(5); # find top 5
  5. db.<collection>.find({},{<field>:1}).sort({<field>:-1}).limit(5); # find bottom 5
  6. db.<collection>.find({<field>:{ $lt: <val>}},{<field>:1}).count(); # count matches
  7. db.runCommand({compact:'<collection>’}) # compact collection

Cassandra – tablestats

How to produce a digest of tables using nodetool

$ nodetool tablestats | awk ‘ /Keyspace/ || /Latency/ {print $0} /Table:/ {gsub(/^[ ][ ]/,””);table=”–> “$0} /Space used/ && $NF > 0 {gsub(/^[ ][ ]/,””);space=space “|” $0} /used by snapshots/ {printf(“%-30s\t%-30s\n”,table,space);table=””;space=””} ‘

Keyspace : system_traces
Read Latency: NaN ms
Write Latency: NaN ms
–> Table: events
–> Table: sessions
Keyspace : system
Read Latency: 4.279434782608696 ms
Write Latency: 0.3454382659499075 ms
–> Table: IndexInfo
–> Table: available_ranges
–> Table: batches
–> Table: batchlog
–> Table: built_views
–> Table: compaction_history |Space used (live): 13424|Space used (total): 13424
–> Table: hints
–> Table: local |Space used (live): 15977|Space used (total): 15977
–> Table: paxos
–> Table: peer_events
–> Table: peers |Space used (live): 14912|Space used (total): 14912
–> Table: prepared_statements
–> Table: range_xfers
–> Table: size_estimates |Space used (live): 94270|Space used (total): 94270
–> Table: sstable_activity |Space used (live): 11098|Space used (total): 11098
–> Table: transferred_ranges
–> Table: views_builds_in_progress
Keyspace : system_distributed
Read Latency: NaN ms
Write Latency: NaN ms
–> Table: parent_repair_history
–> Table: repair_history
–> Table: view_build_status
Keyspace : system_schema
Read Latency: 1.7939485294117647 ms
Write Latency: 2.188590909090909 ms
–> Table: aggregates
–> Table: columns |Space used (live): 18096|Space used (total): 18096
–> Table: dropped_columns
–> Table: functions
–> Table: indexes
–> Table: keyspaces |Space used (live): 10828|Space used (total): 10828
–> Table: tables |Space used (live): 16857|Space used (total): 16857
–> Table: triggers
–> Table: types
–> Table: views
Keyspace : system_auth
Read Latency: 0.241 ms
Write Latency: 0.123 ms
–> Table: resource_role_permissons_index
–> Table: role_members
–> Table: role_permissions
–> Table: roles |Space used (live): 5134|Space used (total): 5134

R – Quickly Graph

How to quickly paste into R and get some results on a Mac (just change pipe/paste for diff OS)

df<-read.table(pipe("pbpaste"),sep=" ")
names(df)<-c("date","time","count")
df$dtg<-strptime(paste(df$date,df$time,sep=" "),"%Y-%m-%d %H:%M:%S")
plot(df$dtg,df$count,las=2)

Datascience – Ruby

Just having a play with ruby and thought I’d try to simulate summary(x):

irb(main):001:0> y=[]
irb(main):002:0> def x();rand(9999);end;
=> :x
irb(main):003:0> def summary(x=0); puts "min: #{x.min} max: #{x.max} mean: #{(x.sum(0.0)/x.size).round(2)}"; end
=> :summary
irb(main):004:0> 99.times do; y<<x;end
=> 99
irb(main):005:0> summary(y)
min: 23 max: 9851 mean: 5127.23

Pandas Numpy and Matplotlib

I have created demo code with Jupyter Notebook, which can be viewed here: https://github.com/marcuspaget/pythonDSFromScratch/blob/master/PandasDemo.md

Panda – Python Data Analysis Library

Quick install with:

pip install pandas

Python’s answer to R’s DataFrames for data manipulation

Providing tools to read and write data between data structures and different formats: CSV and text files, Microsoft Excel, SQL databases, and the fast HDF5 format;

Easily to manipulate, slice and dice data, with integrated indexing.

Possible to convert HDF5 to HDFS for ingestion in Hadoop

Time series-functionality:

  • Date range generation & modification
  • Frequency conversion
  • Moving window statistics
  • Join time series without losing data

Numpy – Python Number Library

pip install numpy
Create, manipulate , slice and run ops i.e std, mean, min, max, etc
Please see link at top for examples

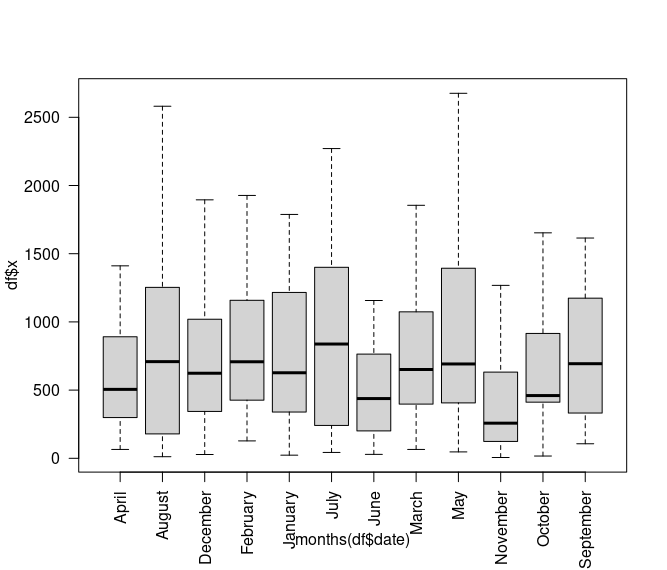
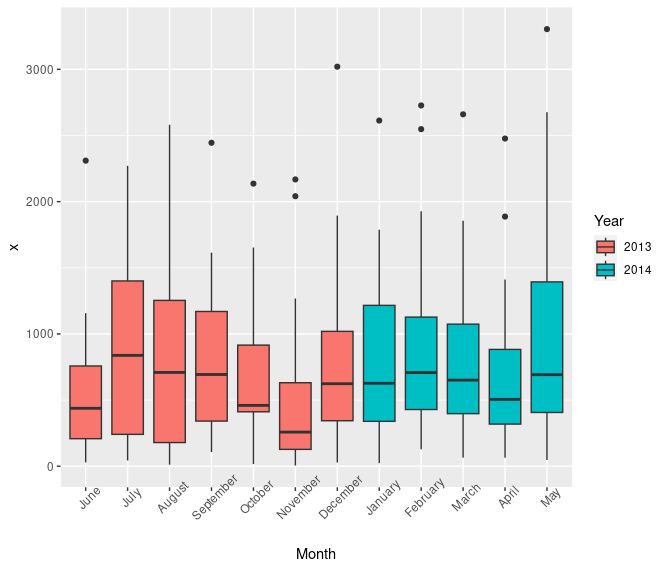
Matplotlib – Python plotting and figures

pip install matplotlib
Graph data from lists, dataframes, etc.

For example:


Matplotlib output example

I have created demo code with Jupyter Notebook, which can be viewed here: https://github.com/marcuspaget/pythonDSFromScratch/blob/master/PandasDemo.md