date <- seq.Date(as.Date("2013-06-01"), as.Date("2014-05-31"), "days") set.seed(100) x <- as.integer(abs(rnorm(365))*1000) df <- data.frame(date, x) boxplot(df$x ~ months(df$date), outline = FALSE,las=2)
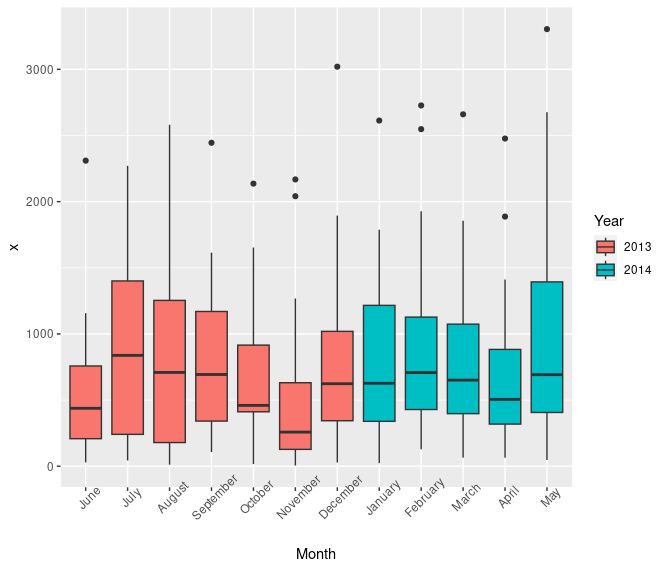
library(ggplot2) ggplot(df) + geom_boxplot(aes(reorder(format(date,'%B'),date),fill=format(date,'%Y'),x)) + xlab('Month') + guides(fill=guide_legend(title="Year")) + theme(axis.text.x = element_text(angle = 45)) 
